Tutorials and Videos
General

Pronto 54 Minute Training Video
Version 5.74
Version 5.74
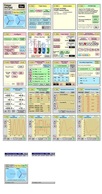
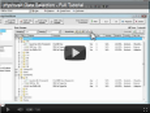
Data Selection - Full Tutorial
As the number of data streams recorded grows (can be over 500 in some of our loggers), it can get hard to find the exact data you want, quickly. So we've enhanced the data selection list, with options to group data streams into folders (e.g. by type, units, etc.) and create favorites of your most used data stream selections.
As the number of data streams recorded grows (can be over 500 in some of our loggers), it can get hard to find the exact data you want, quickly. So we've enhanced the data selection list, with options to group data streams into folders (e.g. by type, units, etc.) and create favorites of your most used data stream selections.
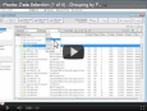
Data Selection (1 of 4) - Grouping by Folder
Part 1 of the Data Selection tutorials shows how to group data into one or two layers of folders.
Part 1 of the Data Selection tutorials shows how to group data into one or two layers of folders.
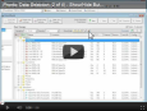
Data Selection (2 of 4) - Show/Hide Buttons
Above the data selection window, there are 5 show/hide buttons, which cover expanding/collapsing all folders, showing only folders with selected items, hiding unselected items and clearing the current selection.
Above the data selection window, there are 5 show/hide buttons, which cover expanding/collapsing all folders, showing only folders with selected items, hiding unselected items and clearing the current selection.
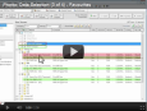
Data Selection (3 of 4) - Using Favorites
A feature of the new data selection window is the ability to save an often used data set as a favorite for quick selection. This tutorial covers how to use favorites, including use of the add, rename and delete buttons.
A feature of the new data selection window is the ability to save an often used data set as a favorite for quick selection. This tutorial covers how to use favorites, including use of the add, rename and delete buttons.
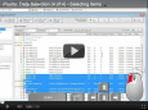
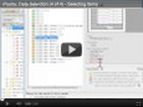
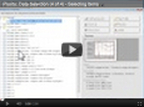
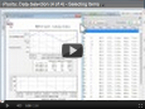
Data Selection (4 of 4) - Selecting Items
This tutorial outlines all the different ways single or multiple data items can be selected using the mouse and/or keyboard in the new data selection window.
This tutorial outlines all the different ways single or multiple data items can be selected using the mouse and/or keyboard in the new data selection window.
Graphs/Views
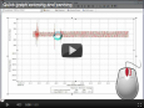
Graph zooming and panning without changing cursor types
Quickly zoom and pan around your graph without using the toolbar or graph menu to swap cursor types.
Quickly zoom and pan around your graph without using the toolbar or graph menu to swap cursor types.
Templates (1 of 3) - Creating/using view (graph) templates
Save your favorite graphs (with all formatting and setup) into view templates that can be APPLIED to new data with just a few clicks.
Save your favorite graphs (with all formatting and setup) into view templates that can be APPLIED to new data with just a few clicks.
Templates (2 of 3) - Organizing view templates
Rename, delete and move into folders. Organize your favorite view templates in an easy to use browser. Also find templates on your hard drive to copy to other computers.
Rename, delete and move into folders. Organize your favorite view templates in an easy to use browser. Also find templates on your hard drive to copy to other computers.
Template (3 of 3) - Editing Duplicating templates
Edit an existing template and see how to create a new template based on an existing template but for different data streams.
Edit an existing template and see how to create a new template based on an existing template but for different data streams.
Tables
Tables (1 of 3) - New look tables in Pronto 6.0
What were Reports in Pronto versions prior to 6.0 are now called Tables and their look and feel is a little different. This tutorial gives an overview of the table generation process, creating a simple table by way of an example. In particular, it gives a simple explanation of how to use the basic functionality of the Table Assistant.
What were Reports in Pronto versions prior to 6.0 are now called Tables and their look and feel is a little different. This tutorial gives an overview of the table generation process, creating a simple table by way of an example. In particular, it gives a simple explanation of how to use the basic functionality of the Table Assistant.
Tables (2 of 3) - Summary Statistics and using table templates
This tutorial follows on from Tables Part 1 and adds the calculation of summary statistics (maximum/minimum column values) to the table to do some basic EN50160 compliance checks. The tutorial also covers how to save a table as a template and then apply the template to data in another project.
This tutorial follows on from Tables Part 1 and adds the calculation of summary statistics (maximum/minimum column values) to the table to do some basic EN50160 compliance checks. The tutorial also covers how to save a table as a template and then apply the template to data in another project.

Tables (3 of 3) - 95th percentile of 50 harmonics example and export to Excel
Using the example of looking at 95th percentiles of 50 harmonics, this tutorial shows how data in a large number of columns can be presented in a concise way, showing only summary statistics, and by transposing the data to show it in rows, not columns. It also shows how to easily export table data to MS Excel.
Using the example of looking at 95th percentiles of 50 harmonics, this tutorial shows how data in a large number of columns can be presented in a concise way, showing only summary statistics, and by transposing the data to show it in rows, not columns. It also shows how to easily export table data to MS Excel.